Top 100 Airports for 2008


Manila Joins the top 50 biggest airports of the World


Top 100 Airports of the World by Seat Capacity on International Departing Flights
Ranking Departure Departure Airport Name Total Number

Airport Code
of Seats
1 LHR LONDON HEATHROW APT 792,747
2 CDG PARIS CHARLES DE GAULLE APT 665,150
3 HKG HONG KONG INTERNATIONAL APT 599,239
4 FRA FRANKFURT INTERNATIONAL APT 562,685
5 DXB DUBAI 517,270
6 SIN SINGAPORE CHANGI APT 477,547
7 AMS AMSTERDAM 475,657
8 BKK BANGKOK SUVARNABHUMI INTERNATIONAL APT 424,902
9 NRT TOKYO NARITA APT 389,046
10 ICN SEOUL INCHEON INTERNATIONAL AIRPORT 386,654
11 MAD MADRID BARAJAS APT 357,083
12 MUC MUNICH INTERNATIONAL AIRPORT 297,224
13 TPE TAIPEI TAIWAN TAOYUAN INTERNATIONAL APT 293,658
14 JFK NEW YORK J F KENNEDY INTERNATIONAL APT 275,823
15 KUL KUALA LUMPUR INTERNATIONAL AIRPORT 266,607
16 ZRH ZURICH AIRPORT 264,303
17 DUB DUBLIN 247,254
18 FCO ROME FIUMICINO APT 245,703
19 LGW LONDON GATWICK APT 238,162
20 VIE VIENNA 225,919
21 BRU BRUSSELS AIRPORT 224,109
22 MIA MIAMI INTERNATIONAL APT 223,768
23 IST ISTANBUL ATATURK AIRPORT 223,474
24 PVG SHANGHAI PUDONG INTERNATIONAL APT 217,021
25 CPH COPENHAGEN APT 214,340
26 STN LONDON STANSTED APT 201,665
27 YYZ TORONTO LESTER B PEARSON INTL APT 200,602
28 MXP MILAN MALPENSA APT 186,981
29 DOH DOHA 183,643
30 BCN BARCELONA APT 182,907
31 LAX LOS ANGELES INTERNATIONAL APT 177,048
32 PEK BEIJING CAPITAL APT 168,985
33 ORY PARIS ORLY APT 166,690
34 GVA GENEVA 166,423
35 DUS DUSSELDORF INTERNATIONAL AIRPORT 147,545
36 SYD SYDNEY KINGSFORD SMITH APT 142,215
37 ARN STOCKHOLM ARLANDA APT 140,810
38 EWR NEWARK LIBERTY INTERNATIONAL APT 139,008
39 PRG PRAGUE 137,325
40 ORD CHICAGO O'HARE INTERNATIONAL APT 137,017
41 LIS LISBON 136,230
42 CAI CAIRO 134,813
43 AUH ABU DHABI INTERNATIONAL APT 133,932
44 BAH BAHRAIN 133,584
45 KIX OSAKA KANSAI INTERNATIONAL AIRPORT 133,314
46 HEL HELSINKI 127,505
47 ATL ATLANTA HARTSFIELD-JACKSON INTL APT 124,469
48 MNL MANILA NINOY AQUINO INTERNATIONAL APT 122,674
49 MAN MANCHESTER INTERNATIONAL APT 120,891
50 BOM MUMBAI 117,721
51 SVO MOSCOW SHEREMETYEVO INTERNATIONAL APT 117,486
52 GRU SAO PAULO GUARULHOS INTL APT 116,836
53 ATH ATHENS INTL ELEFTHERIOS VENIZELOS APT 115,329
54 DEL DELHI 113,568
55 OSL OSLO AIRPORT 112,924
56 KWI KUWAIT 112,765
57 MEX MEXICO CITY JUAREZ INTERNATIONAL APT 109,313
58 CUN CANCUN 108,823
59 JNB JOHANNESBURG O.R. TAMBO INTERNATIONAL 107,585
60 EZE BUENOS AIRES MINISTRO PISTARINI 105,977
61 SJU SAN JUAN LUIS MUNOZ MARIN INTL APT 105,333
62 IAH HOUSTON GEORGE BUSH INTERCONTINENTAL AP 103,839
63 TLV TEL AVIV BEN GURION INTERNATIONAL APT 98,860
64 BUD BUDAPEST 98,389
65 DME MOSCOW DOMODEDOVO APT 96,229
66 SFO SAN FRANCISCO INTERNATIONAL APT 94,440
67 CGK JAKARTA SOEKARNO-HATTA APT 93,271
68 AKL AUCKLAND INTERNATIONAL APT 89,999
69 TXL BERLIN TEGEL APT 88,991
70 YVR VANCOUVER INTERNATIONAL APT 86,582
71 SGN HO CHI MINH CITY 84,400
72 LTN LONDON LUTON APT 84,209
73 IAD WASHINGTON DULLES INTERNATIONAL APT 83,996
74 JED JEDDAH 82,452
75 WAW WARSAW 82,007
76 RUH RIYADH 79,510
77 PTY PANAMA CITY TOCUMEN INTERNATIONAL 78,859
78 BHX BIRMINGHAM INTERNATIONAL AIRPORT 77,917
79 HAM HAMBURG AIRPORT 77,566
80 YUL MONTREAL PIERRE ELLIOTT TRUDEAU INT APT 73,434
81 AGP MALAGA 73,190
82 LIM LIMA 70,898
83 PMI PALMA MALLORCA 68,898
84 CMN CASABLANCA MOHAMED V APT 68,537
85 NGO NAGOYA CHUBU CENTRAIR INTERNATIONAL APT 64,926
86 STR STUTTGART AIRPORT 64,434
87 MEL MELBOURNE AIRPORT 64,411
88 SCL SANTIAGO ARTURO MERINO BENITEZ 64,352
89 DFW DALLAS/FORT WORTH INTL APT 64,275
90 BOG BOGOTA 63,983
91 MCT MUSCAT 62,080
92 MFM MACAU 61,893
93 SHJ SHARJAH 60,948
94 CAN GUANGZHOU 60,707
95 NCE NICE 59,724
96 BGY MILAN ORIO AL SERIO APT 59,281
97 CMB COLOMBO BANDARANAIKE APT 59,250
98 OTP BUCHAREST OTOPENI APT 59,206
99 DPS DENPASAR BALI 58,174
100 LYS LYON SAINT EXUPERY APT 57,640

2008 Top 100 Airlines of the World

PR and 5J joins the top 100 world airlines with most number of flights


Top 100 Airlines by Number of Flights flown for 2008
Ranking Airline Code Airline Name Frequency
1 DL DELTA AIR LINES 25,448
2 AA AMERICAN AIRLINES 24,450
3 UA UNITED AIRLINES 22,807
4 US US AIRWAYS 22,766
5 WN SOUTHWEST AIRLINES 22,213
6 CO CONTINENTAL AIRLINES 17,749
7 NW NORTHWEST AIRLINES 16,671
8 LH LUFTHANSA GERMAN AIRLINES 12,785
9 AF AIR FRANCE 10,828
10 AC AIR CANADA 10,119
11 CZ CHINA SOUTHERN AIRLINES 9,034
12 MU CHINA EASTERN AIRLINES 7,786
13 FR RYANAIR 7,420
14 NH ALL NIPPON AIRWAYS 6,832
15 JJ TAM LINHAS AEREAS 6,513
16 IB IBERIA 6,372
17 CA AIR CHINA 6,141
18 BA BRITISH AIRWAYS 5,895
19 AS ALASKA AIRLINES 5,646
20 SK SAS SCANDINAVIAN AIRLINES 5,511
21 U2 EASYJET 5,318
22 G3 VARIG 5,243
23 JL JAPAN AIRLINES INTERNATIONAL 5,192
24 QF QANTAS AIRWAYS 4,907
25 FL AIRTRAN AIRWAYS 4,805
26 B6 JETBLUE AIRWAYS CORPORATION 4,317
27 NZ AIR NEW ZEALAND 4,181
28 KL KLM-ROYAL DUTCH AIRLINES 3,884
29 TK TURKISH AIRLINES 3,479
30 AB AIR BERLIN 3,418
31 AM AEROMEXICO 3,361
32 BE FLYBE 2,984
33 DJ VIRGIN BLUE 2,962
34 IT KINGFISHER AIRLINES 2,930
35 AZ NEW ALITALIA 2,743
36 SA SOUTH AFRICAN AIRWAYS 2,673
37 MH MALAYSIA AIRLINES 2,647
38 OS AUSTRIAN AIRLINES AG 2,637
39 MX MEXICANA DE AVIACION 2,633
40 LX SWISS 2,608
41 SV SAUDI ARABIAN AIRLINES 2,586
42 9W JET AIRWAYS INDIA 2,572
43 WS WESTJET 2,560
44 KE KOREAN AIR 2,542
45 ZH SHENZHEN AIRLINES 2,528
46 HU HAINAN AIRLINES 2,429
47 AV AVIANCA 2,286
48 F9 FRONTIER AIRLINES INC. 2,235
49 IC INDIAN AIRLINES 2,197
50 EK EMIRATES 2,135
51 WF WIDEROE'S FLYVESELSKAP 2,030
52 LA LAN AIRLINES 2,012
53 AK AIRASIA 1,970
54 ZK GREAT LAKES AIRLINES 1,947
55 TP TAP AIR PORTUGAL 1,866
56 2F FRONTIER FLYING SERVICE 1,817
57 MF XIAMEN AIRLINES COMPANY 1,814
58 OZ ASIANA AIRLINES 1,813
59 AY FINNAIR 1,799
60 GA GARUDA INDONESIA 1,783
61 9K CAPE AIR 1,750
62 TG THAI AIRWAYS INTERNATIONAL 1,736
63 FM SHANGHAI AIRLINES 1,694
64 CM COPA AIRLINES 1,650
65 BD BMI BRITISH MIDLAND 1,573
66 AP AIR ONE 1,561
67 PR PHILIPPINE AIRLINES 1,561
68 DY NORWEGIAN AIR SHUTTLE 1,547
69 SU AEROFLOT RUSSIAN AIRLINES 1,541
70 3U SICHUAN AIRLINES 1,516
71 OA OLYMPIC AIRLINES 1,515
72 MS EGYPTAIR 1,497
73 5J CEBU PACIFIC AIR 1,478
74 CX CATHAY PACIFIC AIRWAYS 1,471
75 LO LOT - POLISH AIRLINES 1,464
76 HA HAWAIIAN AIRLINES 1,428
77 OK CZECH AIRLINES 1,427
78 SQ SINGAPORE AIRLINES 1,408
79 SN BRUSSELS AIRLINES 1,397
80 QR QATAR AIRWAYS 1,380
81 JK SPANAIR 1,349
82 YX MIDWEST AIRLINES 1,332
83 SC SHANDONG AIRLINES 1,330
84 VN VIETNAM AIRLINES 1,325
85 EI AER LINGUS 1,322
86 JT LION AIR 1,313
87 JQ JETSTAR AIRWAYS 1,299
88 ZL REGIONAL EXPRESS 1,218
89 NT BINTER CANARIAS 1,112
90 AR AEROLINEAS ARGENTINAS 1,103
91 NK SPIRIT AIRLINES 1,077
92 GS GRAND CHINA EXPRESS 1,074
93 A3 AEGEAN AIRLINES 1,023
94 4C AIRES 1,020
95 4U GERMANWINGS 996
96 AT ROYAL AIR MAROC 975
97 PK PAKISTAN INTERNATIONAL AIRLINES 974
98 UX AIR EUROPA 974
99 X3 TUIFLY 961
100 JV BEARSKIN AIRLINES 950

Economic Gloom Continues in January Traffic

Philippine based Airline unperturbed

March 2, 2009

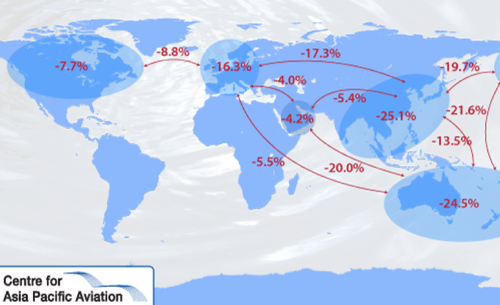
Geneva - The International Air Transport Association (IATA) announced international scheduled traffic results for January showing a deepening year-on-year demand slump.

International passenger demand fell by 5.6% in January 2009 compared to the same month in 2008. It is also a full percentage point worse than the 4.6% year-on-year drop recorded in December. The January fall in demand is the fifth consecutive month of contraction.

The 5.6% drop in passenger demand outpaced capacity cuts of 2.0% driving the load factor to 72.8% - 2.8% below what was recorded for January 2008.

The alarming collapse in cargo markets in December (-22.6%) worsened in January 2009 with a 23.2% year-on-year demand drop. This is the eighth consecutive month of contraction for freight traffic.

“Alarm bells are ringing everywhere. Every region’s carriers are reporting big drops in cargo. And, aside from the Middle East carriers, passenger demand is falling in all regions. The industry is in a global crisis and we have not yet seen the bottom,” said Giovanni Bisignani, IATA’s Director General and CEO.

Passenger

  • Asian carriers led the decline in passenger demand with an 8.4% year-on-year drop in January. While this is slightly better than the 9.7% contraction in December, this is positively skewed by Chinese New Year which fell at the end of January 2009 (and which was in February the year before). Capacity in the region contracted 4.3%. With Japan, the region’s largest market for air travel, expected to see its economy contract by an unprecedented 5% in 2009, the prospects for traffic in the region remain dismal.
  • North American carriers posted the second largest passenger decline at 6.2% led by a decline in Trans-Pacific travel. In response, carriers withdrew 2.6% of their international capacity, clawing back some of the expansion of 2008.
  • European carriers offset a 5.7% decline in demand with a 3.6% decrease in capacity. Demand decreased sharply from the 2.7% fall in December as European economies move into deep recession.
  • Latin American carriers saw a modest decline of 1.4%. Even against a 0.5% increase in capacity, the region turned in the highest load factors at 74.9%.
  • African carriers saw the demand decline slow from an average 4.0% in 2008 to 2.6% in January.
  • The Middle East was the only region with a positive traffic growth of 3.1%. This is far below both the double-digit traffic growth in 2008 and the 10.8% expansion in capacity.

Cargo

  • Asia Pacific carriers, representing 43% of the market, led the cargo decline with a 28.1% year-on-year drop. This was followed closely by the other major market players: European carriers (-23.0%) and North American carriers (-19.3%).
  • While this may appear to be relatively stabilised compared to the precipitous December drop, it is too soon to call a bottom in the air freight market. Manufacturers are still shedding inventory and cutting production which is expected to lead to further falls in freight volumes.

“The only good news is that fuel prices remain well below last year’s level. But the drop in demand is much more harmful. The industry is shrinking with revenues expected to fall by US$35 billion to US$500 billion, delivering a loss of US$2.5 billion this year,” said Bisignani.

“Airlines remain in intensive care, but while others ask for government bailouts, our demands on Governments are much more modest. First, don’t tax us to death in order to pay for investments in the banking industry. This includes the UK government’s plans to increase its multi-billion pound Air Passenger Duty and the Dutch Government’s misguided departure tax,” said Bisignani. In 2008, even as governments delivered tax breaks to stimulate economic growth, the airline industry took on an additional tax burden of US$6.9 billion.

“Second, give airlines the commercial freedoms that every other business takes for granted. With the world’s capital markets in disarray, archaic ownership restrictions are an unnecessary burden that must be lifted. Today’s crisis highlights the need to change the structure of this hyper-fragmented and fragile industry,” said Bisignani, referring to IATA’s Agenda for Freedom initiative.

Despite the bleak numbers, budget carrier Cebu Pacific said its additional aircraft are coming to its fleet this year that would increase its passenger volume to about 9 million from 6.747 million in 2008.

Cebu Pacific, Zest Airways and Philippine Airlines are expanding their fleet this year to service new routes despite global slump.

In the Philippines, foreign tourist arrivals from China, Hong Kong and Taiwan were up by more than 60 percent in January from a year ago, according to the Tourism Department. The Philippine aviation market remains on the bright side amidst Asian slump as international carriers operating in and out of manila hold on to its capacity while others announced additional seat offers. Other destinations in the region are not as lucky as they were plagued by capacity cuts by airlines and dwindling passenger demand.

Jan 2009 vs. Jan 2008 RPK Growth ASK Growth PLF FTK Growth ATK Growth
Africa -2.6% -0.6% 71.1 -19.8% -2.0%
Asia/Pacific -8.4% -4.3% 73.5 -28.1% -8.9%
Europe -5.7% -3.6% 71.3 -23.0% -5.7%
Latin America -1.4% 0.5% 74.9 -17.2% -0.1%
Middle East 3.1% 10.8% 71.9 -6.1% 7.3%
North America -6.2% -2.6% 74.3 -19.3% -3.6%
Industry -5.6% -2.0% 72.8 -23.2% -4.9%
2008 vs. 2007 RPK Growth ASK Growth PLF FTK Growth ATK Growth
Africa -4.0% -4.2% 70.2 -2.5% -7.4%
Asia/Pacific -1.5% 1.2% 73.9 -6.6% -2.5%
Europe 1.8% 3.8% 76.6 -2.8% 2.9%
Latin America 10.2% 9.2% 74.0 -13.5% 5.7%
Middle East 7.0% 8.6% 74.9 6.3% 8.5%
North America 2.9% 4.3% 79.8 -1.9% 3.4%
Industry 1.6% 3.5% 75.9 -4.0% 1.5%

InterIsland opens flight to Vigan

March 1, 2009


Manila- Charter airline and air taxi company InterIsland intends to commence domestic scheduled flights to Mindoro airport in Vigan starting March 19 from Manila domestic airport.

The Luc Helgen airline will operate 4 times a week on Thursday, Friday, Sunday and Monday schedule utilizing 60 seater Yakolev 40 aircraft.

Ilocos Sur Governor Deogracias Victor "DV" B. Savellano said that "With the existence of these flights, the province and Vigan City will become more accessible to foreign and domestic tourists and investors, which will contribute to the improvement of our trade and commercial industries."

"When more tourists' will arrived in the province, the private transport sectors and producers of unique local products will greatly benefited, thus, the presence of commercial flights in Vigan airport will generate job opportunities and better income to the local residents," he added.

To sustain the flights, the airline needs a load of at least 30 passengers per flight. Air fare for one- way travel of a passenger starts from P3, 450.00.

Vigan City is a UNESCO Heritage Site located on the western coast of Luzon which is facing the South China Sea.

The airline operates non-scheduled passenger and cargo air charter services to Caticlan, Tablas, Coron and Busuanga.

NAIA Terminal 1 is ready for two A380


March 1, 2009

Manila - Manila International Airport Authority general manager Alfonso Cusi disclosed that Terminal 1 is now ready to accommodate 2 Airbus 380 at any given time.

Cusi, in an interview with reporters recently, said that "MIAA has been focusing on how to turn NAIA into a globally competitive airport, providing new facilities and services consistent with international standards".

The NAIA airport complex would undergo further improvements in anticipation of the other international airline transfer at Terminal 3. Cusi said that the existing runway already could manage to service large new aircrafts as noted by the 2007 team of the A380. But the taxiway need further expansion to accommodate wide body jets of airlines that will operate at Terminal 3. Currently they are expanding the airport taxiway for wide body jet maneuvers.

A Cebu Pacific plane was recently stuck at its expanded taxiway when it ran into the wet asphalt that was not yet cured. The taxiways in front of Terminal 3 and old Domestic Terminal used to accommodate only narrow body jets from Cebu Pacific, Zest Air and Air Philippines.

With the transfer, 3 million more will be added to Terminal 3 capacity in the short term as the complex’s total terminal capacity increase to 32 million passengers a year in the next five to 10 years.